7.7.2016
I have dealt with solar cells measurement in my previous job. Because now my company is engaged in custom software development, I have not leave my previous work and I also provides support for the elderly application. Measurement of solar cell we have in our references.
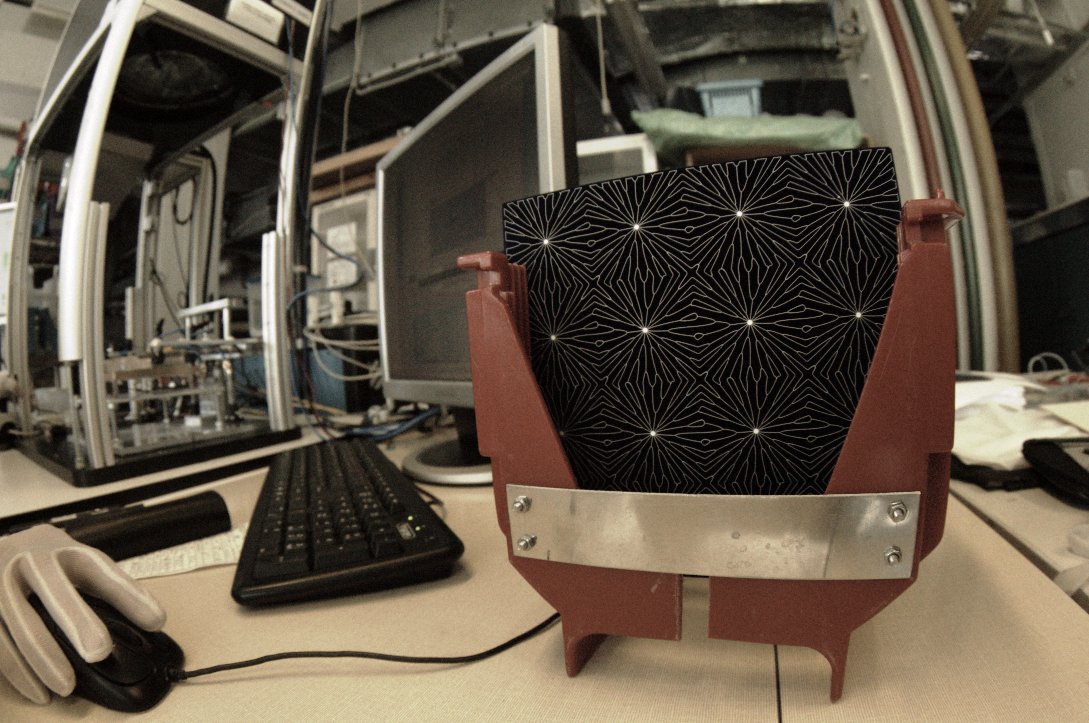
Fill Factory is a company in Rožnov producing custom solar cells. The application for the measurement works a lot of years here. Small problems appeared a few weeks ago. New ECN solar cells are so interesting that I took a picture:
Solar cell producer need to measure many various parameters. One of the most important parameter is the power produced by the cell at full sun light.
Practically the solar cell is lit with sun light equivalent and the power supply is connected to solar cell. Then the voltage changes from -1 to +1 volts (voltage may vary). Few hundreds pairs of voltage and current are measured which are then used to compute all demanded parameters. One of the parameters is the maximum possible power.
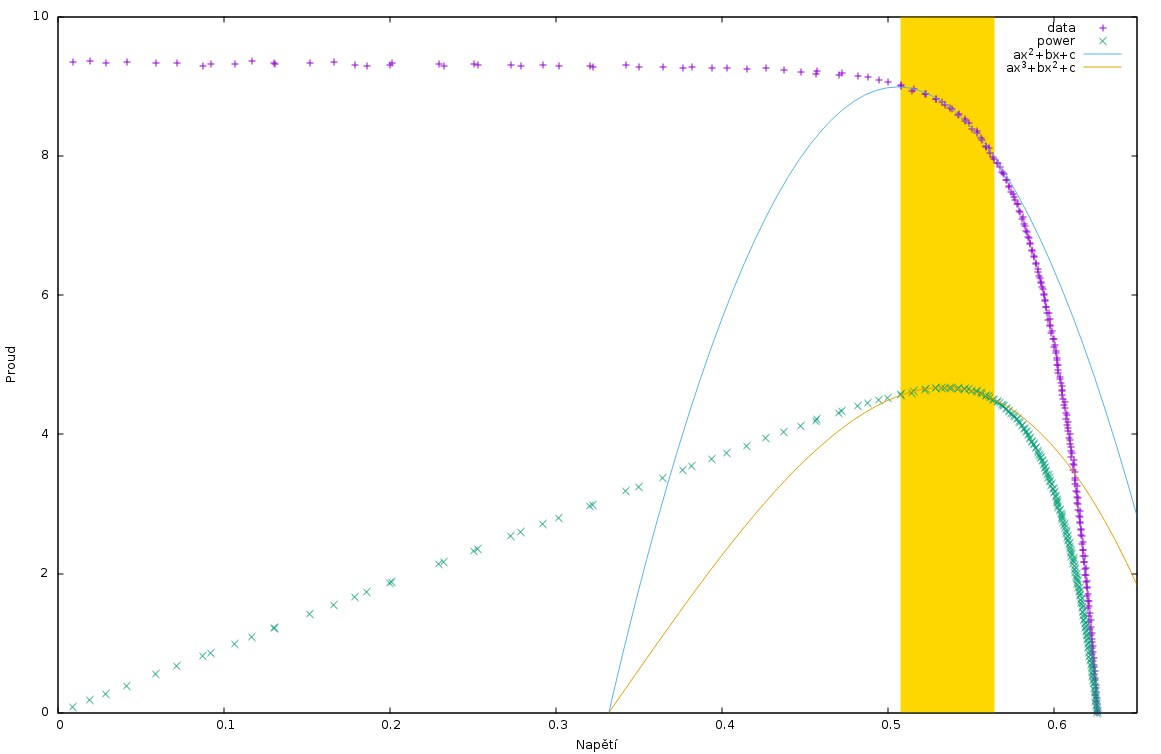
The measured values are pointed with blue plus signs. The power at every point is computed easily:
power = voltage × current
Power values are pointed with green crosses.
When I want to find maximum power, the task seems to be trivial: it would be sufficient to compute power in every measured point and choose point with the maximum value.
Although at first glance it looks like a simple task, such naive approach gives very often completely wrong results.
The series of the values is very often disturbed with some impulses. When a person look at such measurement he can easily recognize items out of order and he can filter such points automatically. But the naive algorithm has no such filters. Naive algorithm recognizes as a maximum power point every random disturbance appeared in data.
There is a need for data filtering. At first I wanted to use some kind of digital filters. But the data series are not huge enough to allow digital filter to work properly. Much useful was the other idea - regression analysis.
There are more important points exists than the maximum power. The solar cell characteristic on the image is not complete - measured point exist also out of the chart. Important parameters are points where the cell characteristic crosses x and y axes and the slope is also important. The regression analysis can be used at the points very easily since the neighborhood of the points can be approximated with a straight line.
But the whole characteristic can be modeled with exponential equation:
y = a + becx
It is very hard to use such equation in regression analysis for me. When looking for minimal error in regression analysis it is needed to differentiate the equation. My mathematical kung-fu is very weak to solve the task. But I thought that I could approximate the interesting part of the characteristic with a polynomial equation. In reality it is sufficient to use parabola close to the maximum power point:
y = ax² + bx + c
Equations for regression analysis on parabola I simply found in a textbook.
On the picture the values used for regression analysis are highlighted with yellow bar. The parabola is drawn with blue color.
If the characteristic is quoted as
y = ax² + bx + c
then the power is
P = ax³ + bx² + cx
The power line is drawn with orange color. Yellow bar highlights points used to compute power curve.
Maximal power it at the point where the derivation is equal to zero:
(ax³ + bx² + cx)' = 3ax² + 2bx + c = 0
Problem is now reduced to solve quadratic equation.
Problems appeared when the application tried to find maximum power point. The range of points used for the polynomial approximation was too wide. New solar cells produced in Fill Factory nowadays have much sharper curvature of the characteristic and the parabola found with regression analysis could not approximate the characteristic with required accuracy. Aleš Poruba found the source of lower accuracy very quickly.
